Lead: Peter Sanful (UENR, Ghana) Email: peter.sanful@uenr.edu.gh
Co-lead: Thomas Davidson (AU, Denmark) Email: thd@bios.au.dk
Karsten Rinke (UFZ, Germany) Email: karsten.rinke@ufz.de
Bertram Boehrer (UFZ, Germany) Email: bertram.boehrer@ufz.de
Tom Shatwell (UFZ, Germany) Email: tom.shatwell@ufz.de
Asha Damoah (PhD Student) Email: ladydamoah@gmail.com
Solomon Amfoh (MPhil Student) Email: solokwabena@gmail.com
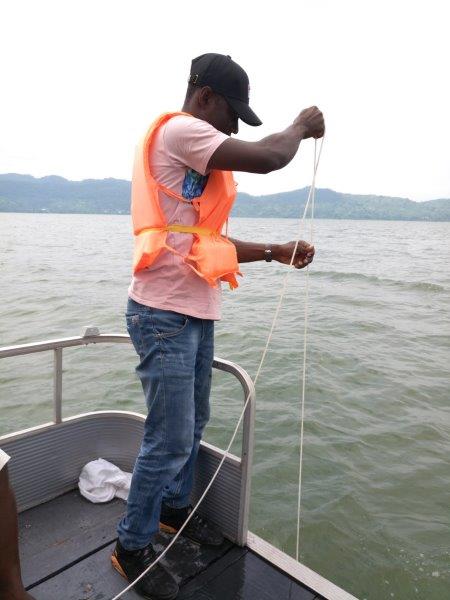
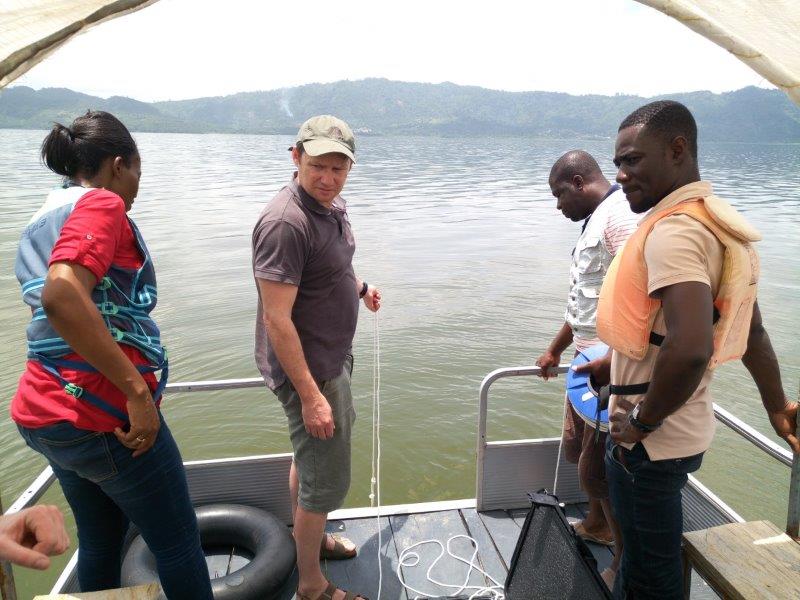
This WP involves a combination of collecting historical data and new high-frequency of in-crater meteorology and key measurements of physical, chemical and biological properties of the lake. These activities will collect data on seasonal, annual and interannual meteorological forcing factors, thermal stability, intensity and frequency of mixing events, vertical nutrient fluxes, primary production and zooplankton biomass. Nutrient concentrations will be assessed to quantify fluxes between upper-mixed layer and hypolimnion during stratification and upwelling events to determine the degree of nutrient limitation on phytoplankton. These data will be utilized to develop a lake model (in WP2) to enable predictions of limnological and biological responses under different climatic scenarios that have implications for fisheries management. We will analyze ion balance and gas loads in the deep interior of Lake Bosumtwi in order to assess the risk of persistent meromixis.
Main Deliverables
- Understand climate forcing on lake physics, chemistry and primary production, secondary production
- Assess risk of persistent meromixis
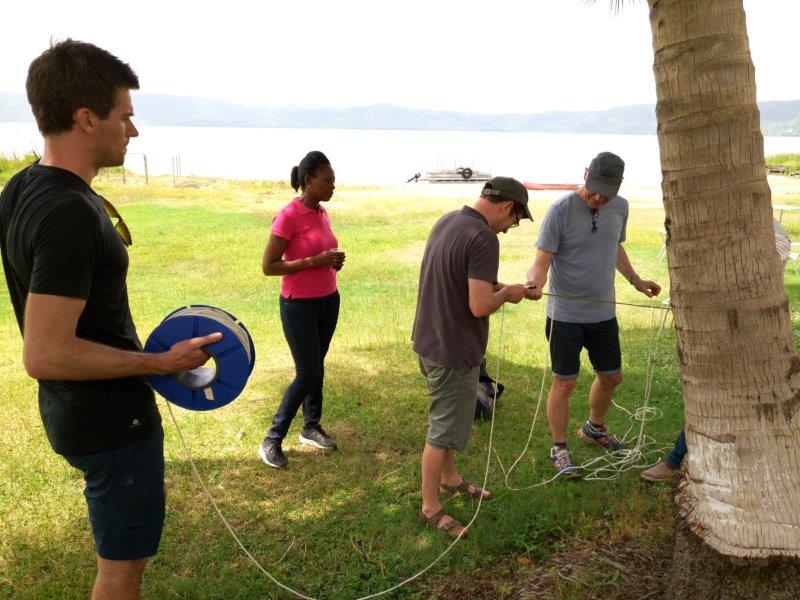
Task 1.1: Setup field sampling protocols and outline laboratory procedures.
Task 1.2: Deploy automated measuring systems.
Task 1.3: Routine fieldwork, limnological sampling (approx. bi-weekly for two years), laboratory analyses, maintenance of automated measuring systems.
Task 1.4: Implement data management protocols and conduct quality assurance of data for ecological model in WP2.
Task 1.5: Assessment of thermal structure, mixing dynamics, nutrient fluxes, primary productivity based on data from routine monitoring.
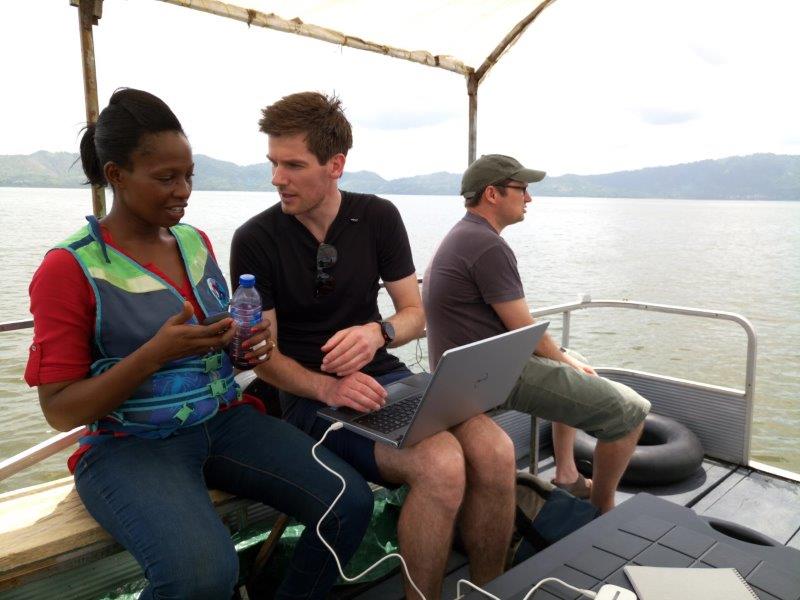
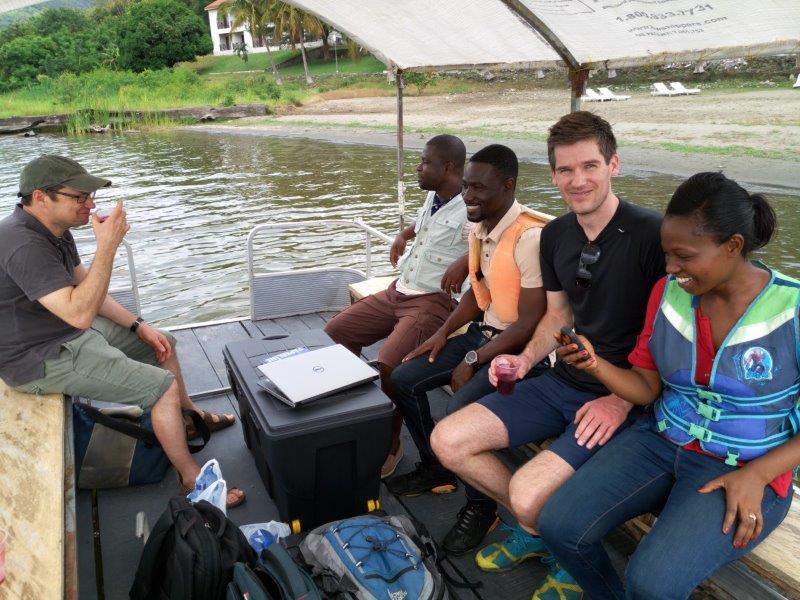
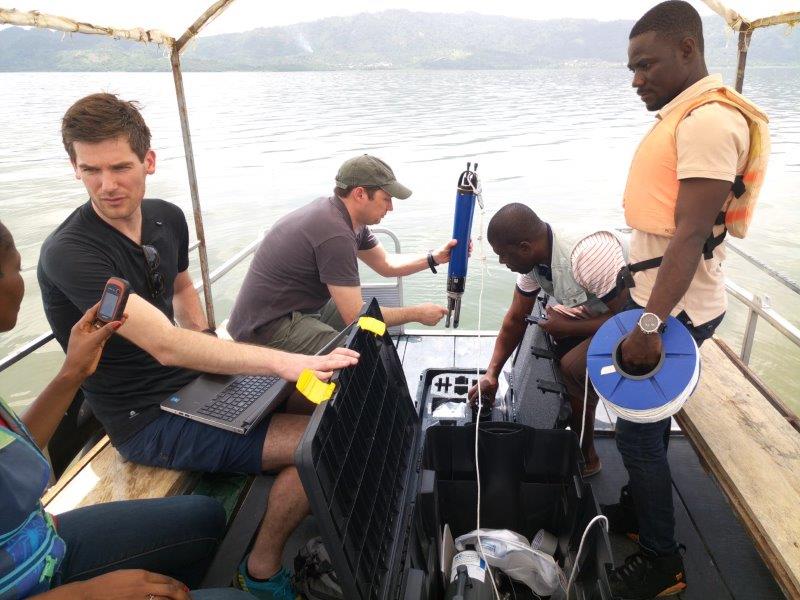
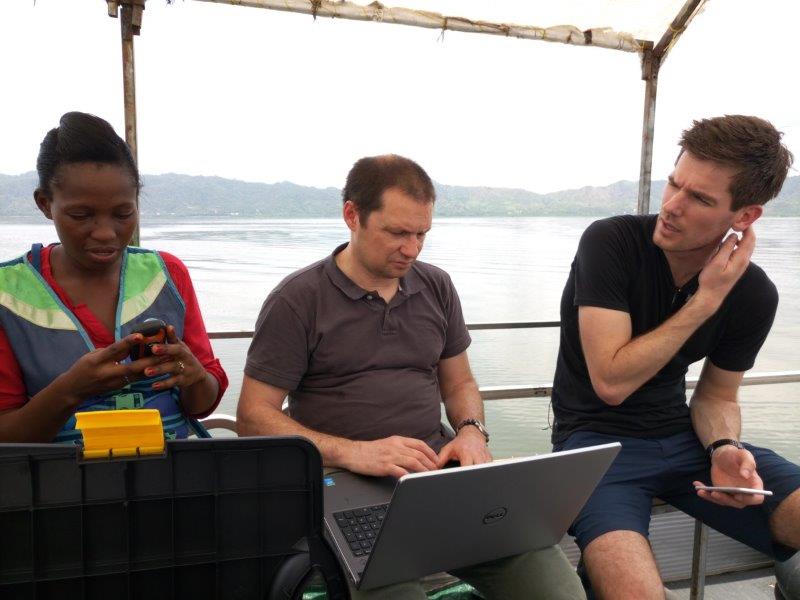
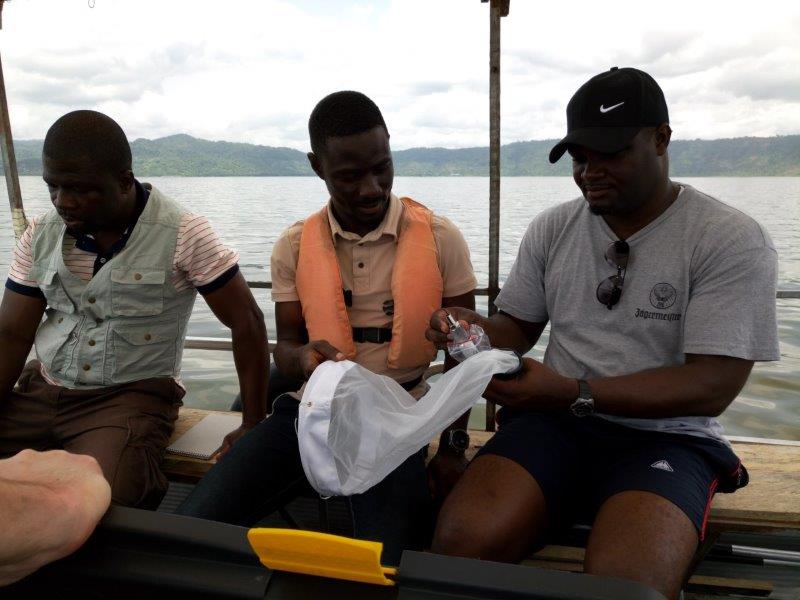
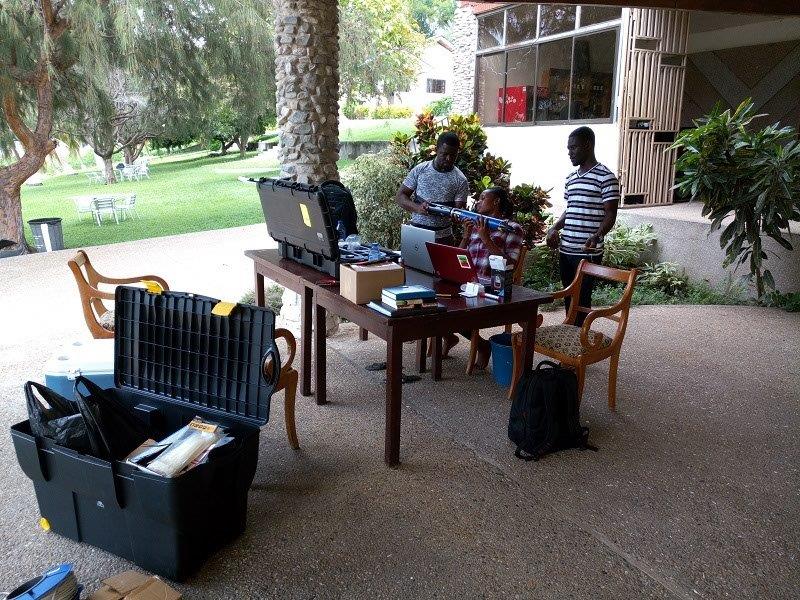
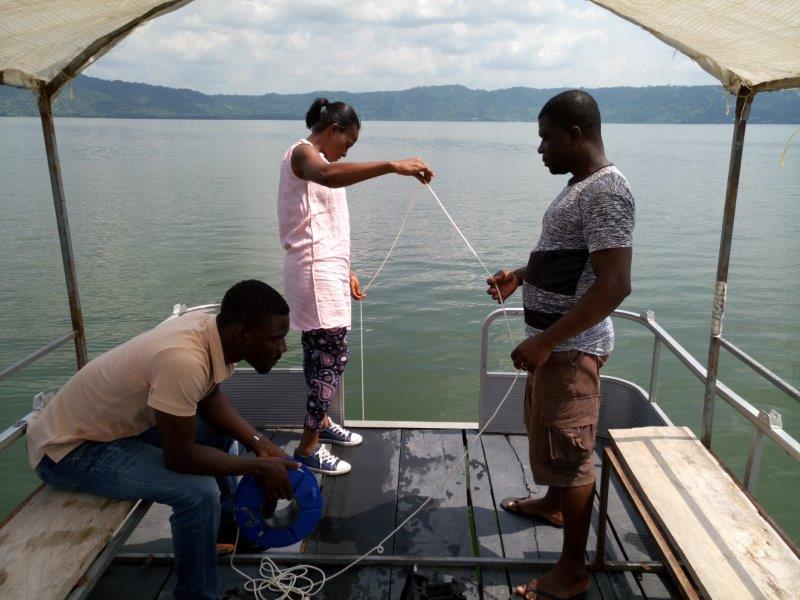
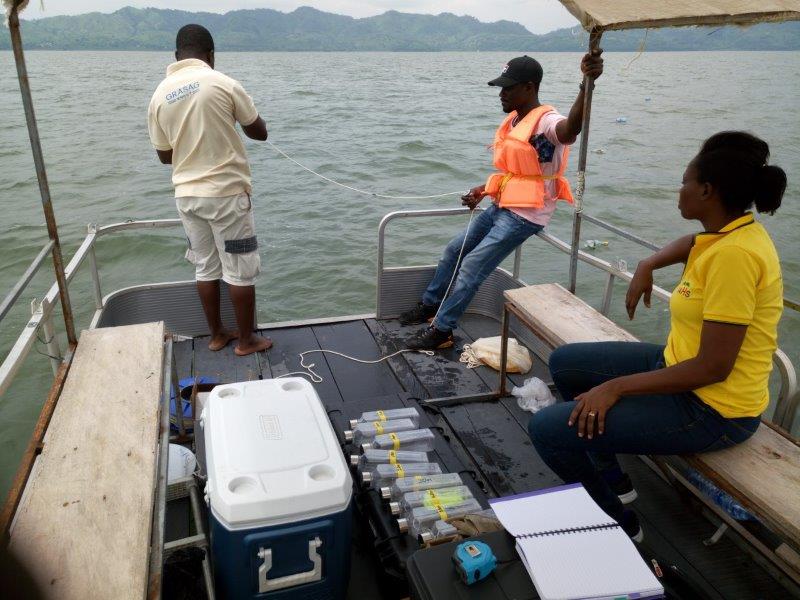
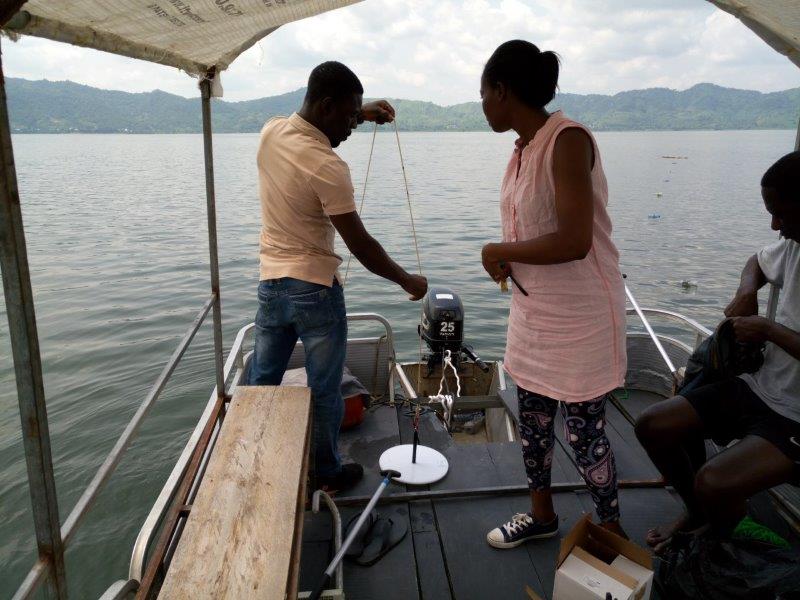
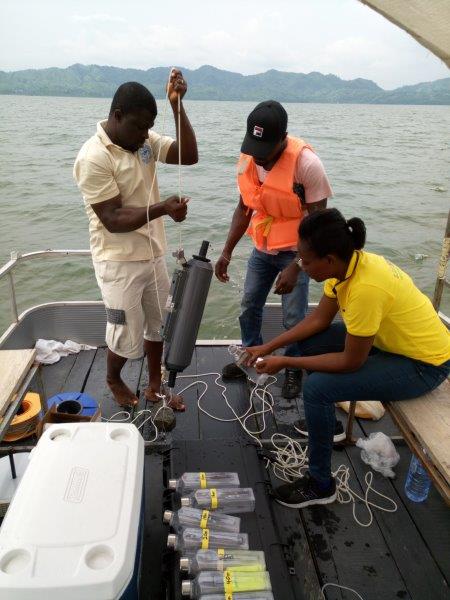
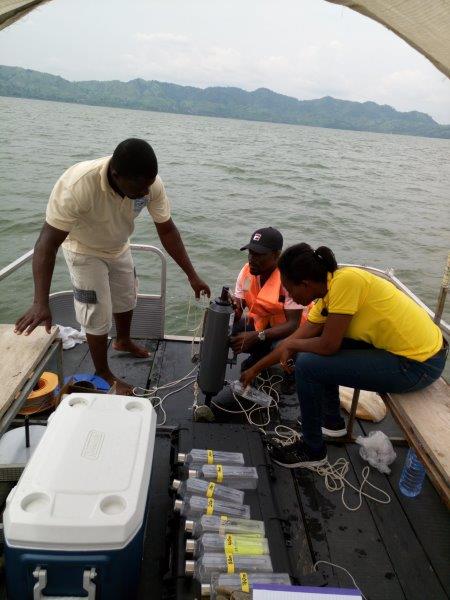
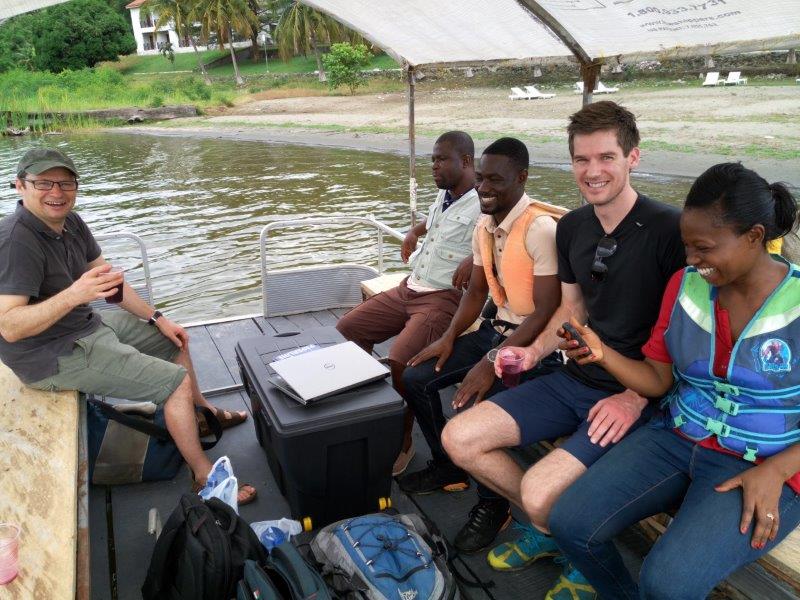
Photo Gallery